base plot
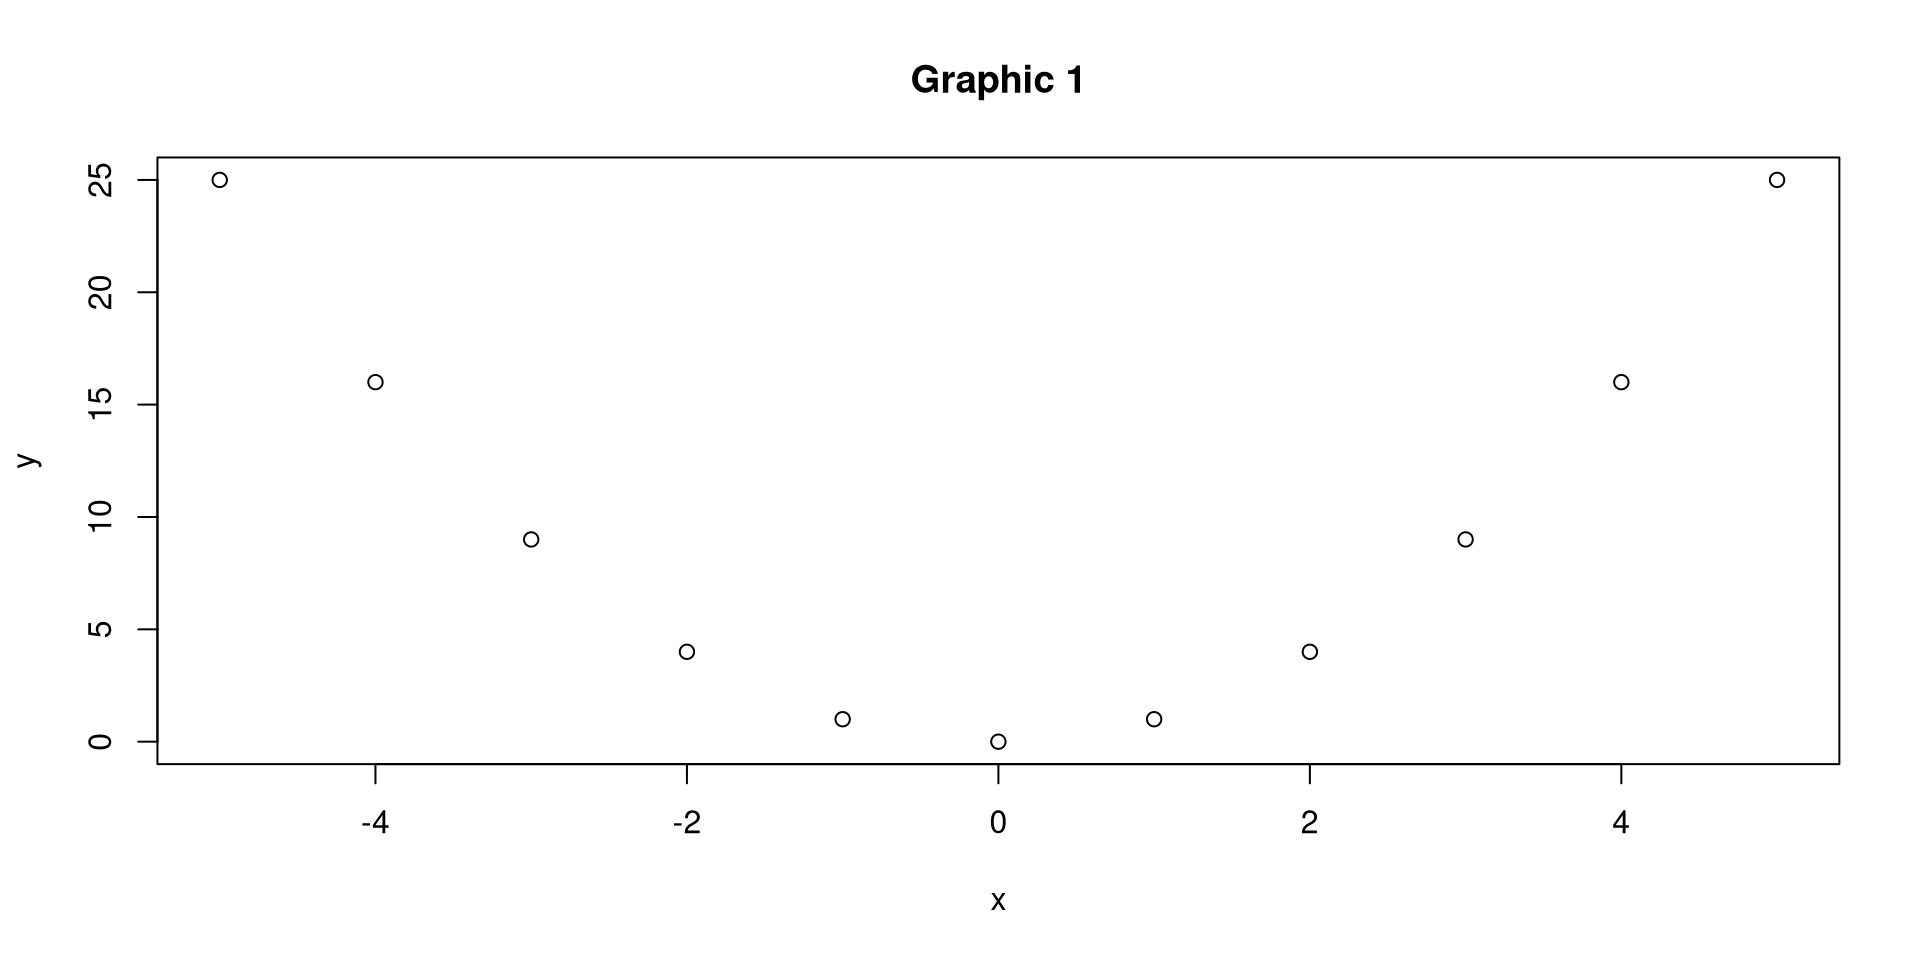
Scatter plot
A basic scatter plot is created with the basic plot function
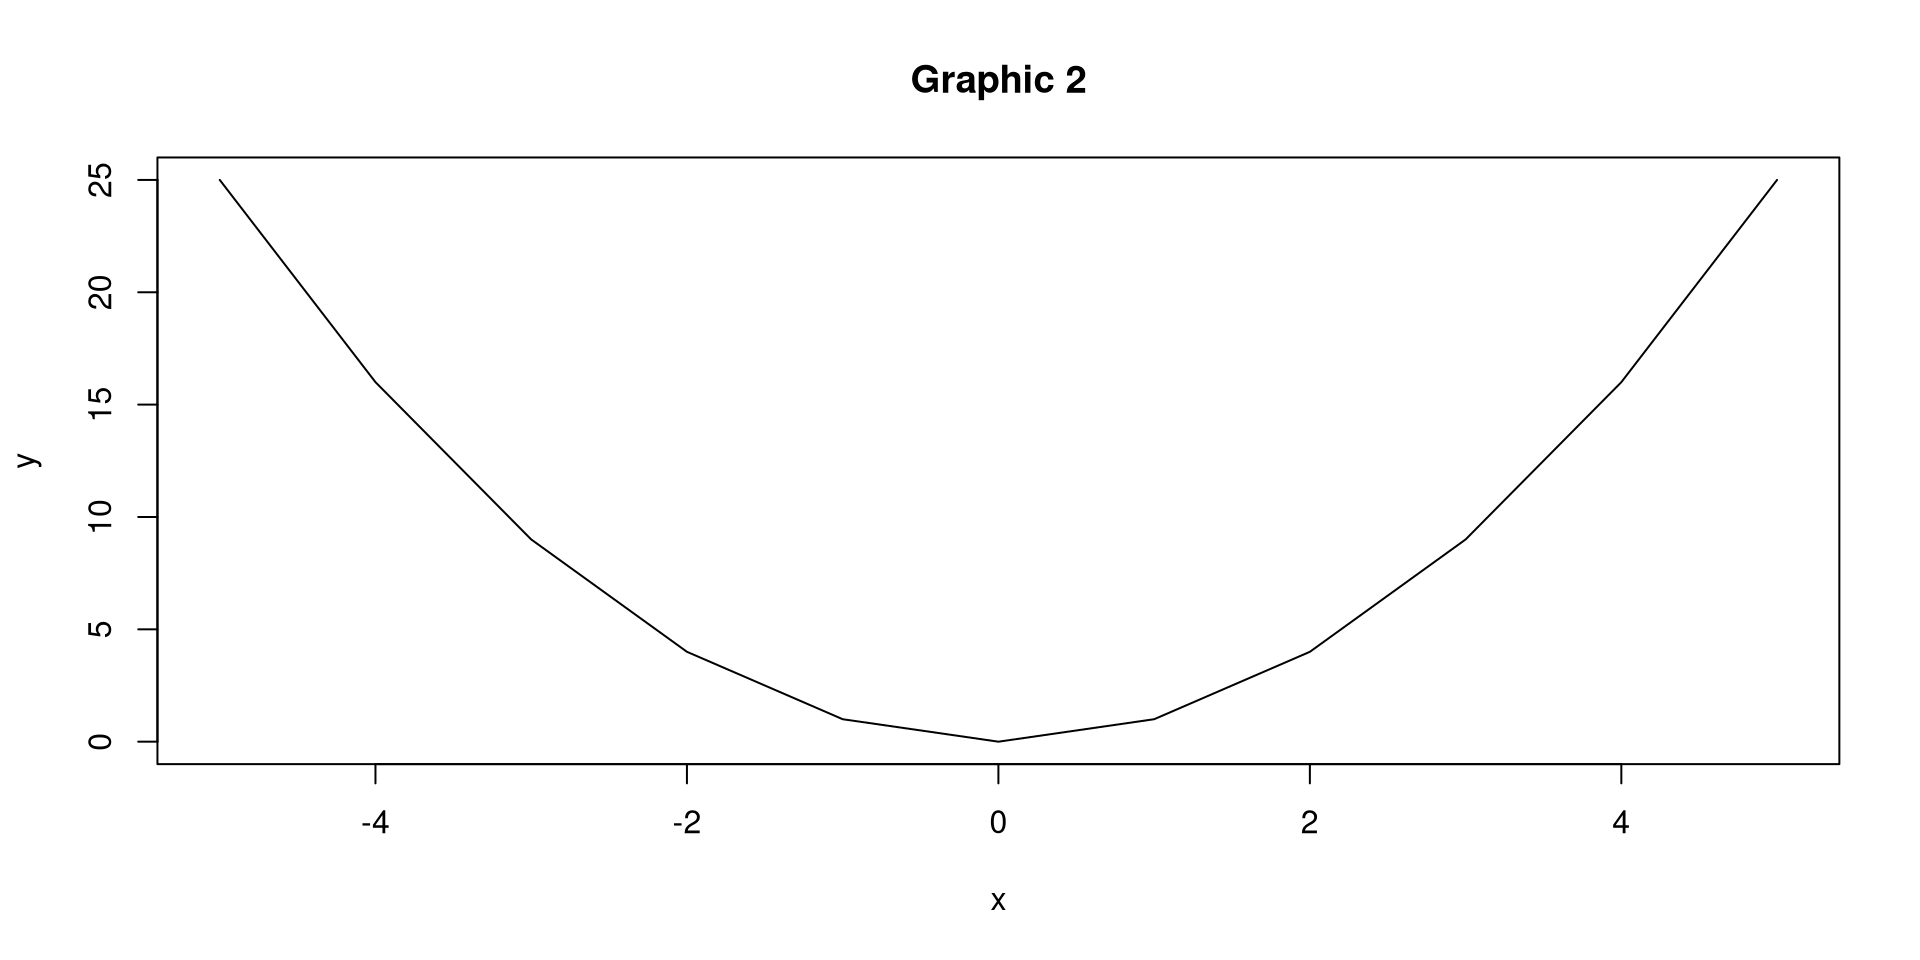
Line plot
- A basic line plot is also created with the basic plot function (with additional type)
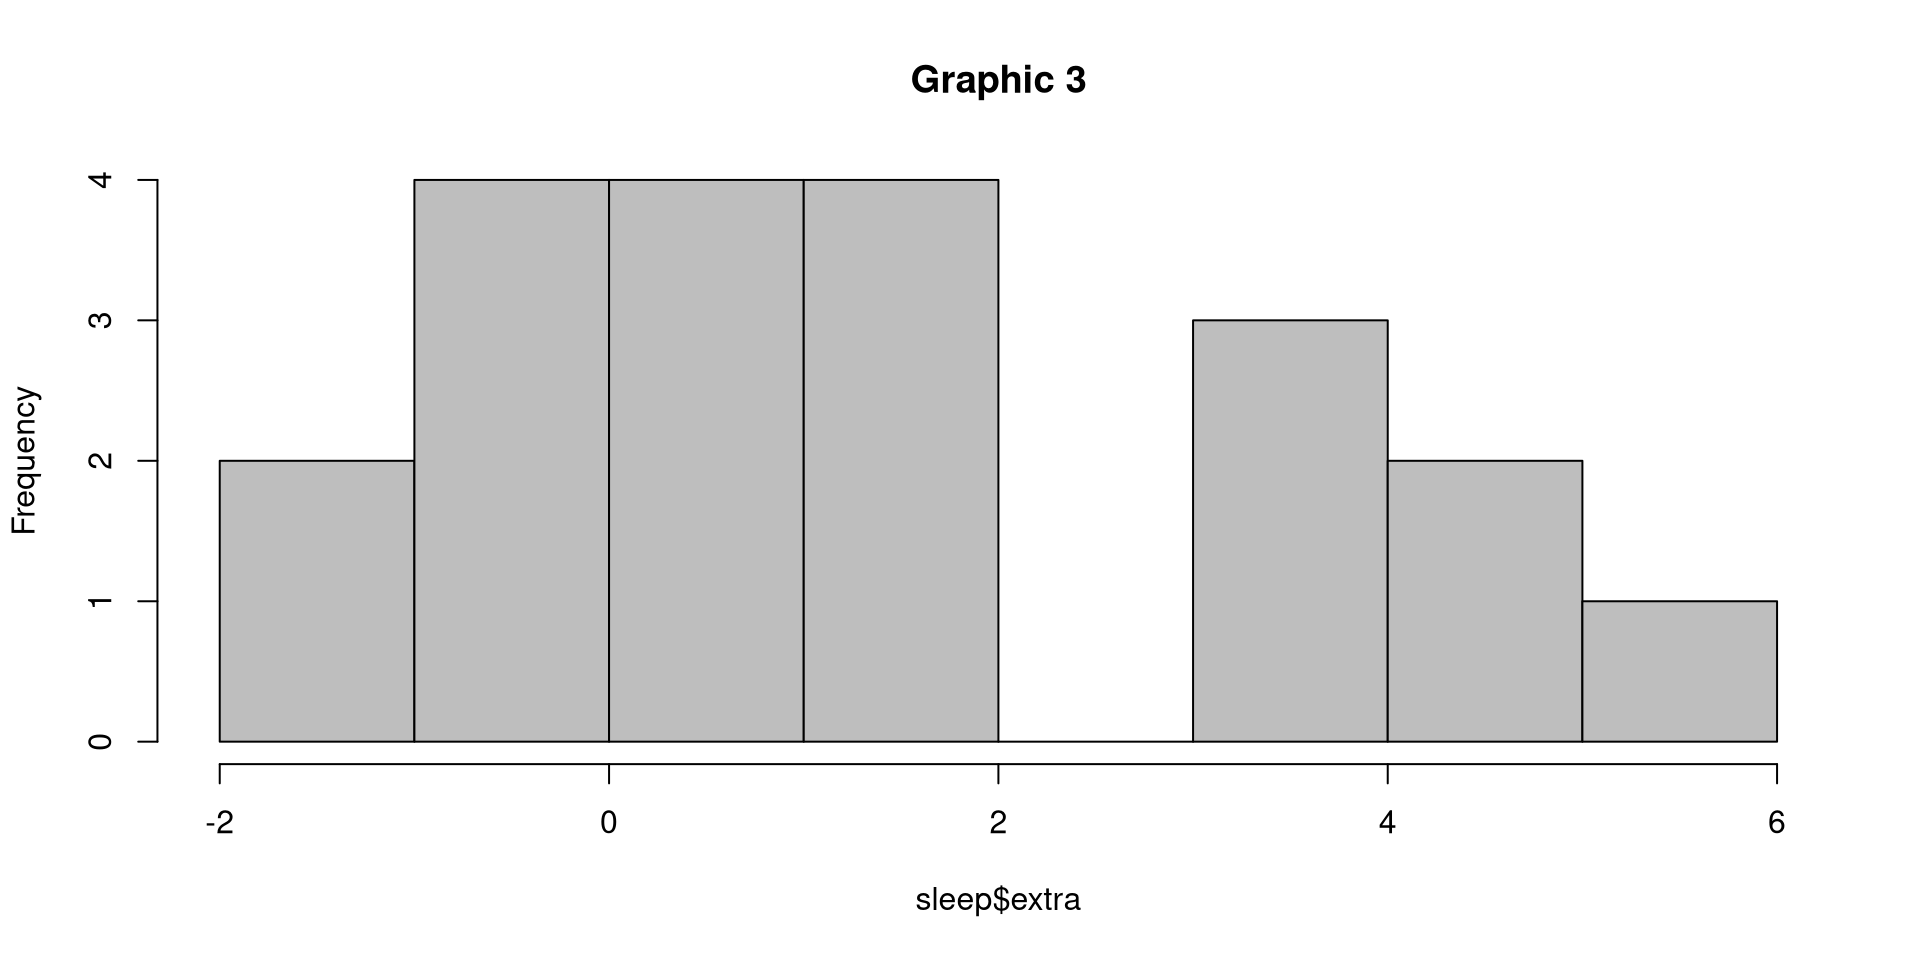
Histogram set color
We use the built-in data set
sleep.Histogram using a single vector:
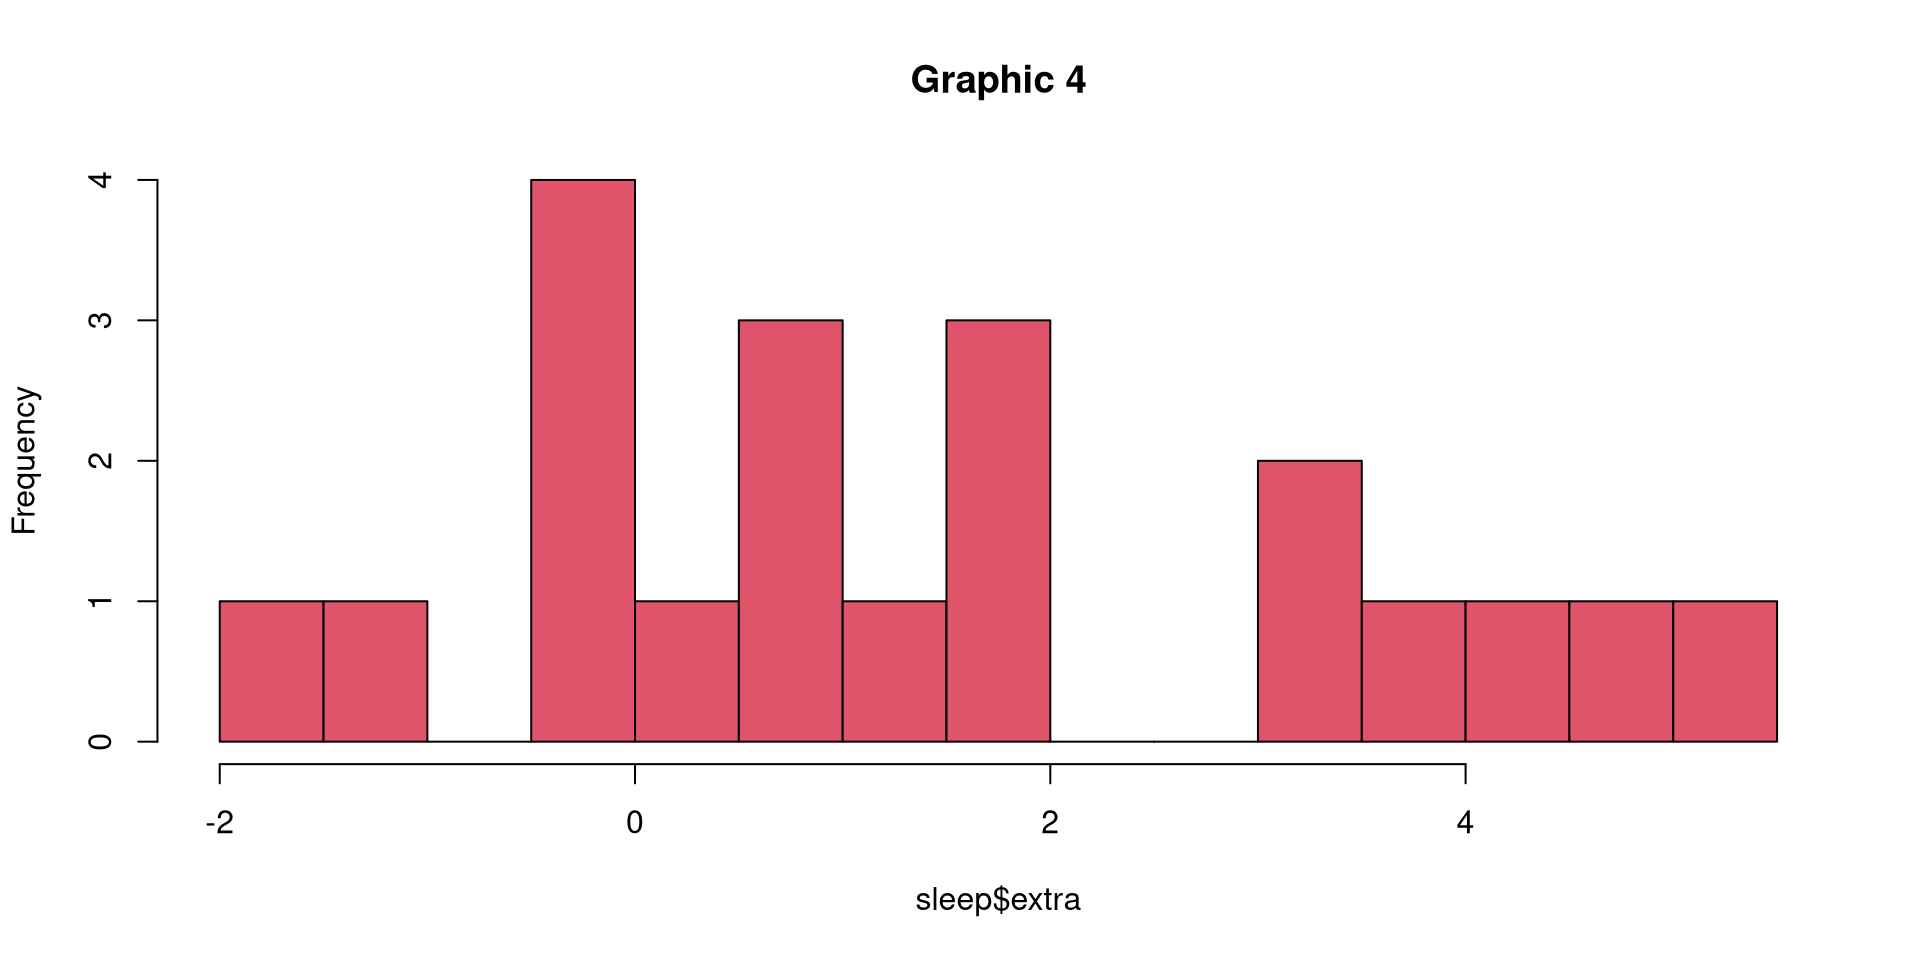
Histogram set breaks
- A basic histogram with a custom number of breaks in red:
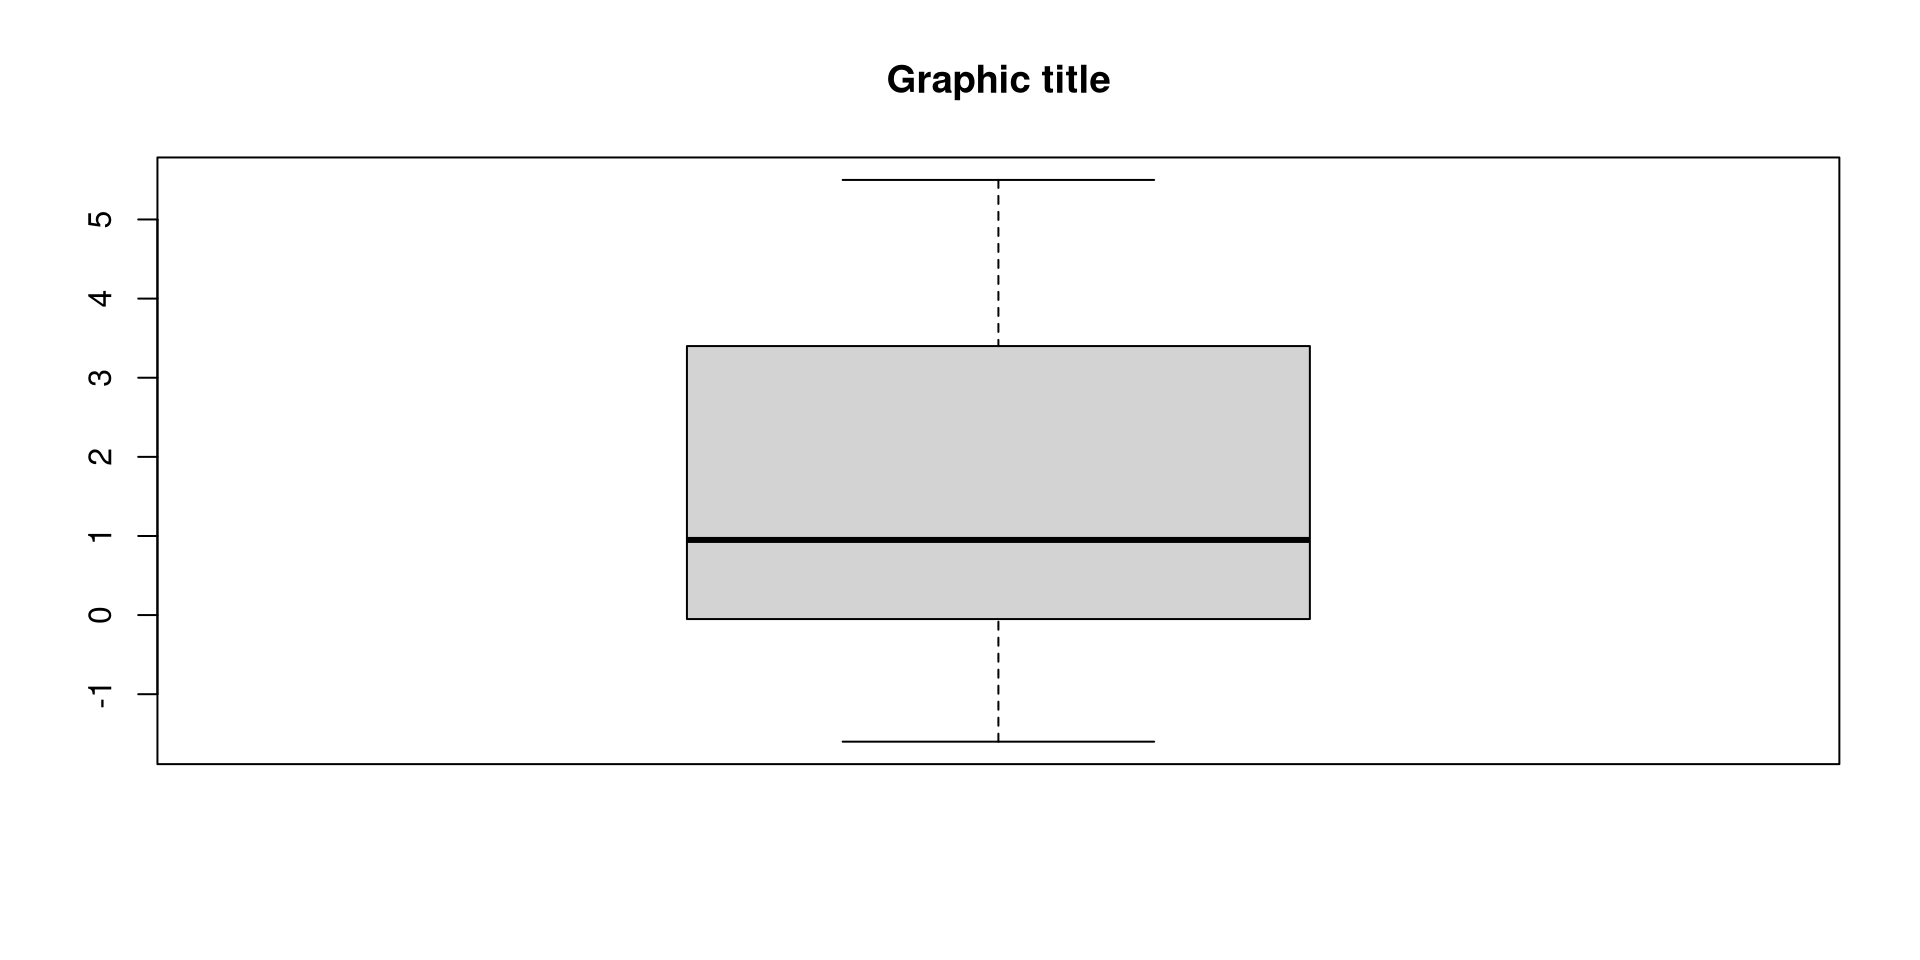
Single boxplot
- Basic boxplot derived from one vector:
Multiple boxplots
A boxplot with formula operator to make a boxplot for each group
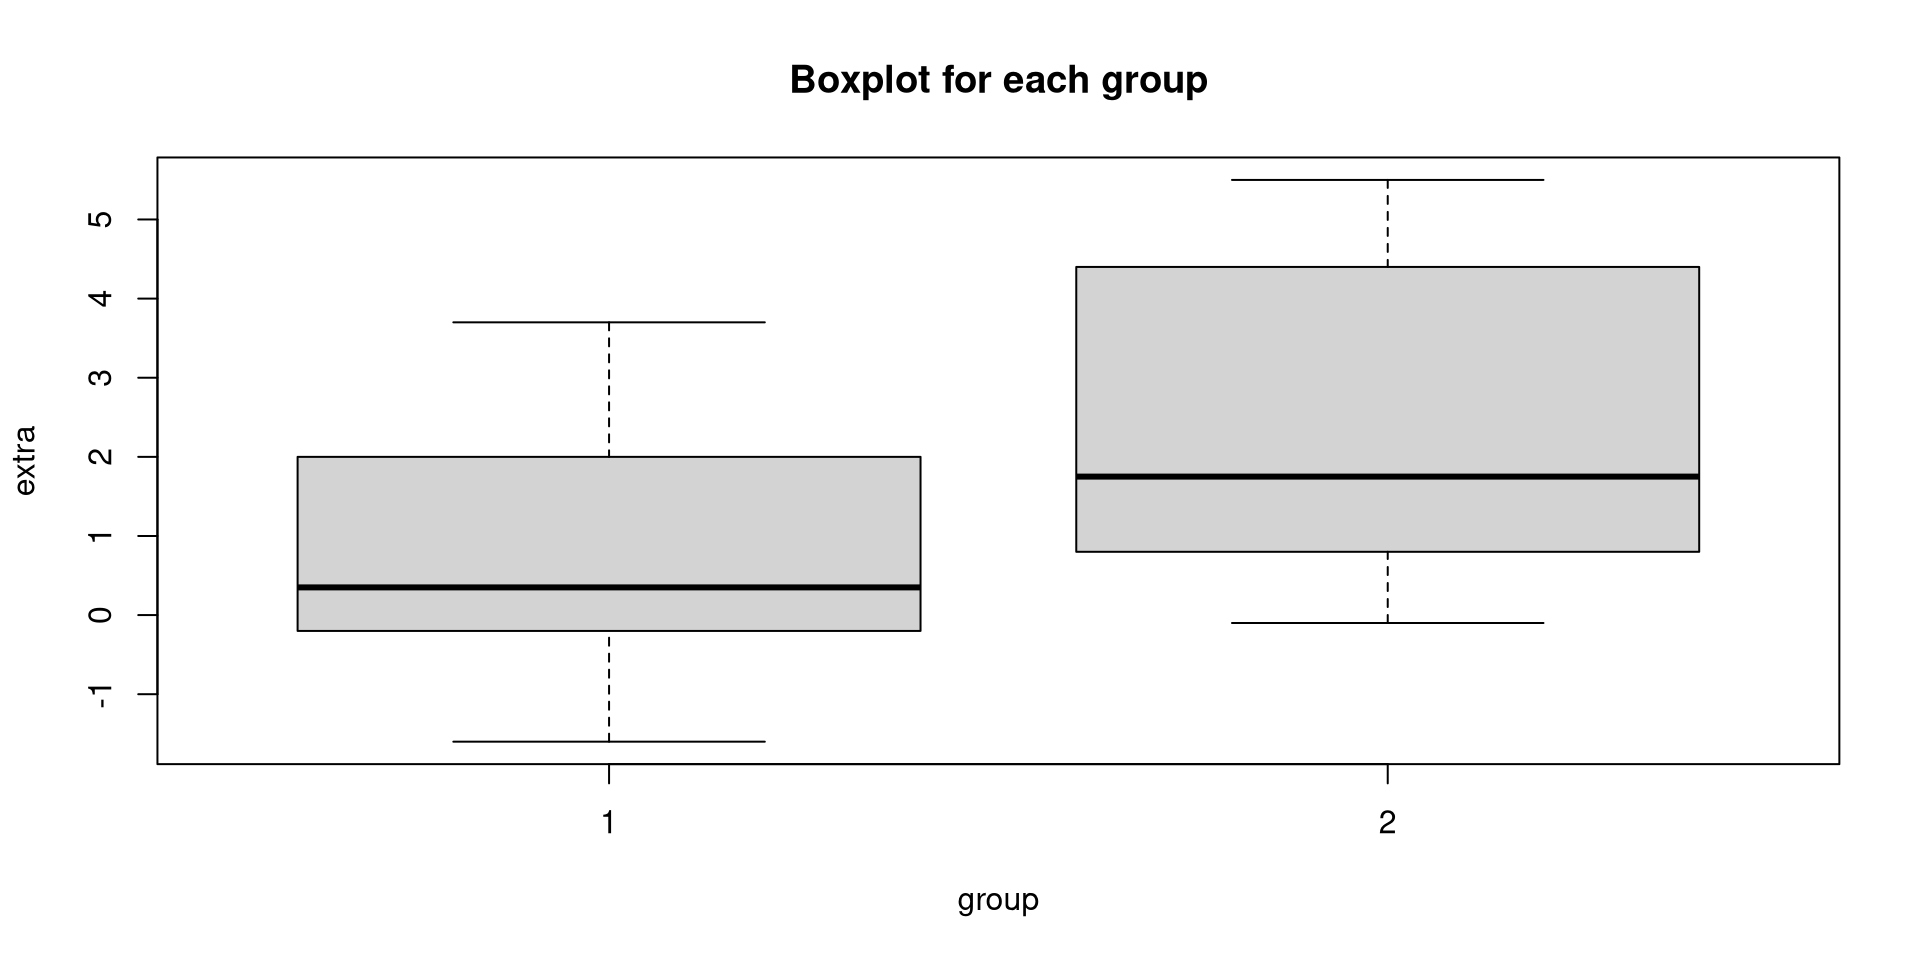
This basically splits the vector into two vectors: one for each group.