x <- seq(0, 10, lengh.out = 100)Warning: In seq.default(0, 10, lengh.out = 100) :
extra argument 'lengh.out' will be disregardedx containing 100 values between 0 and 10.x <- seq(0, 10, lengh.out = 100)Warning: In seq.default(0, 10, lengh.out = 100) :
extra argument 'lengh.out' will be disregardedy using sin(x).y <- sin(x)plot(x, y, pch = 20)
plot(y, x, pch = 20, xlab = "x", ylab = "y")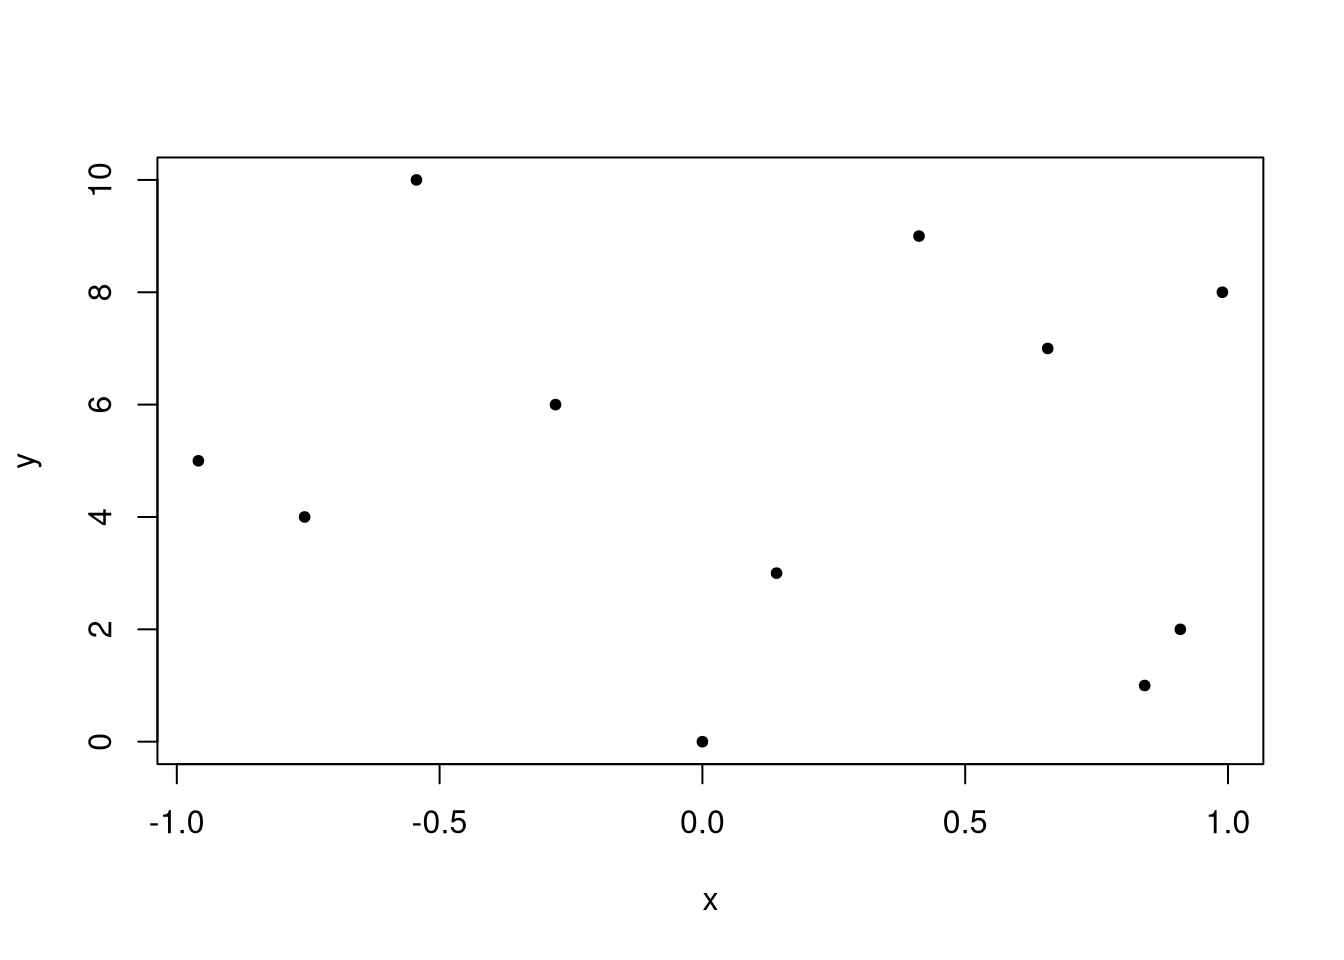
lty = 2.plot(x, y, type = "l", lty = 2, main = "Sinus function")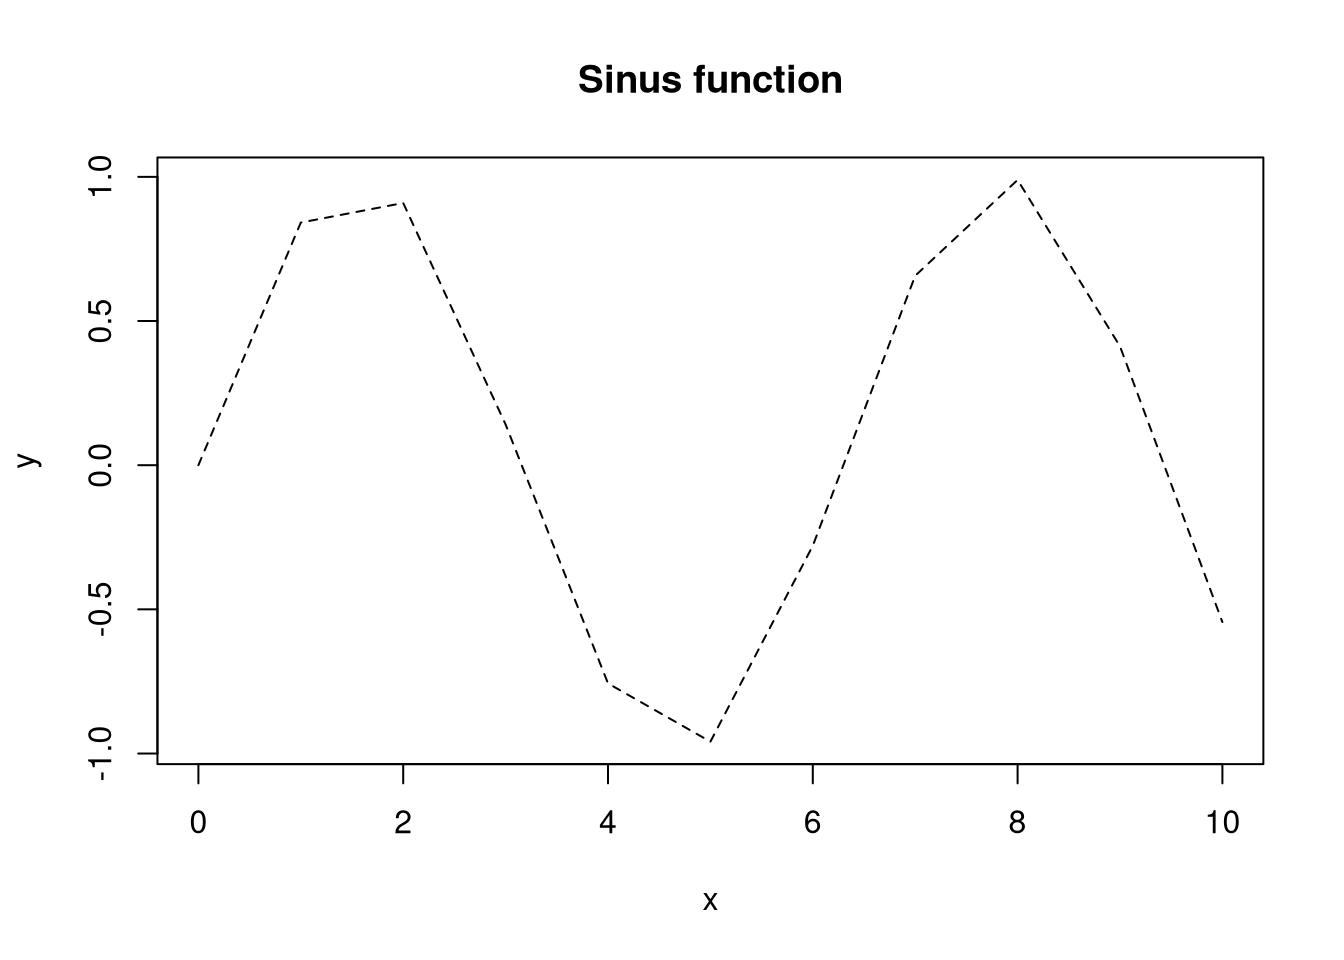
lines() function to add a line.plot(x, y, type = "l", lty = 2, main = "Sinus function")
plot(x, y, pch = 20)
x <- c(1:10, 1:20, 1:30, 1:40, 1:50). Plot a histogram using 5 breaks.x = c(1:10, 1:20, 1:30, 1:40, 1:50)
hist(x, breaks = 5)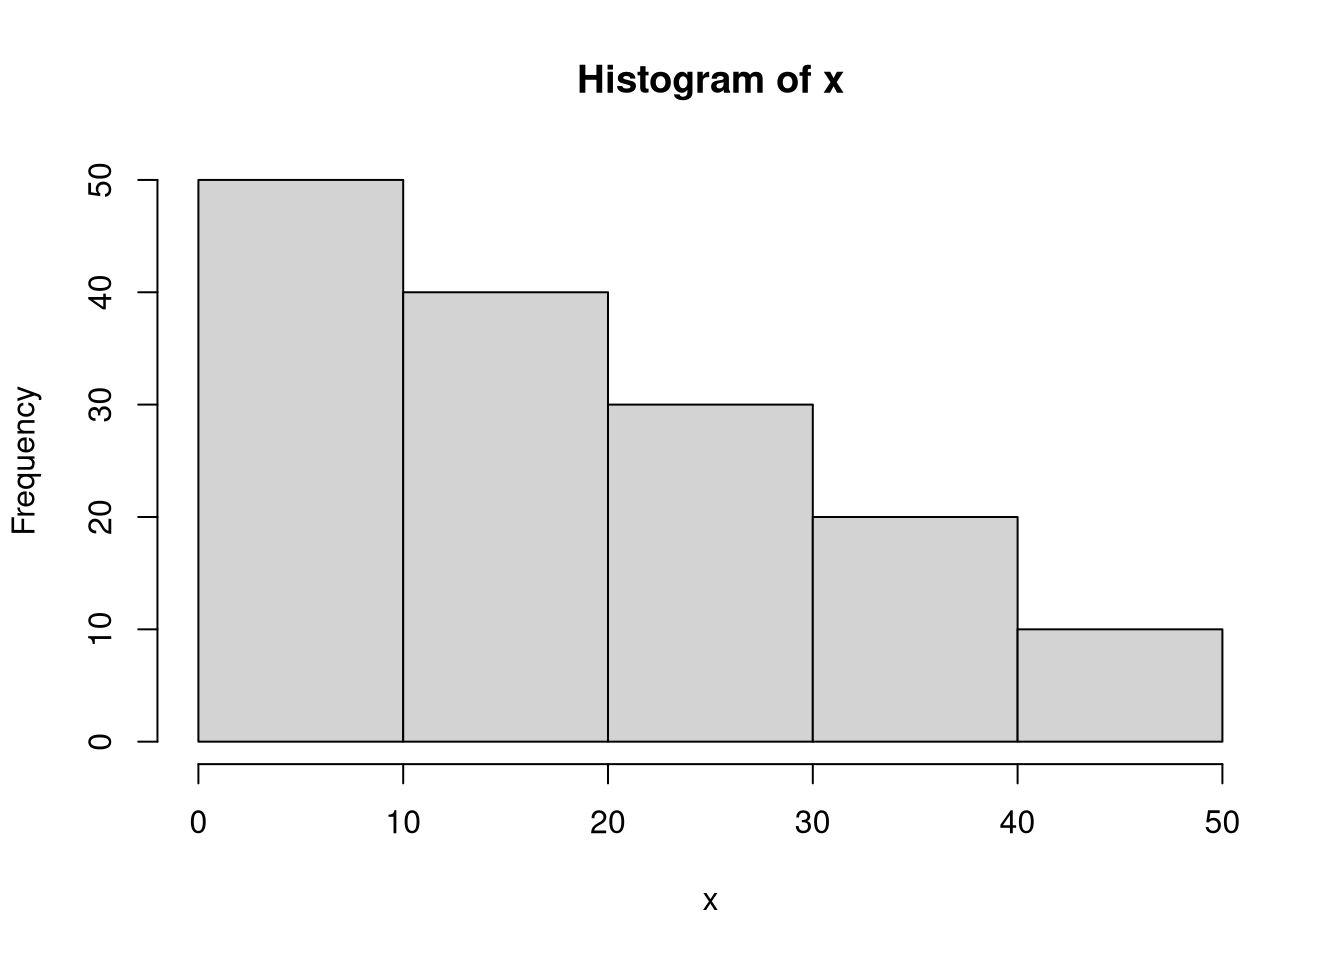
1:50 and y-axis values 50:1. Use the additional argument lwd = 2.hist(x, breaks = 5)
lines(1:50, 50:1, lwd = 2)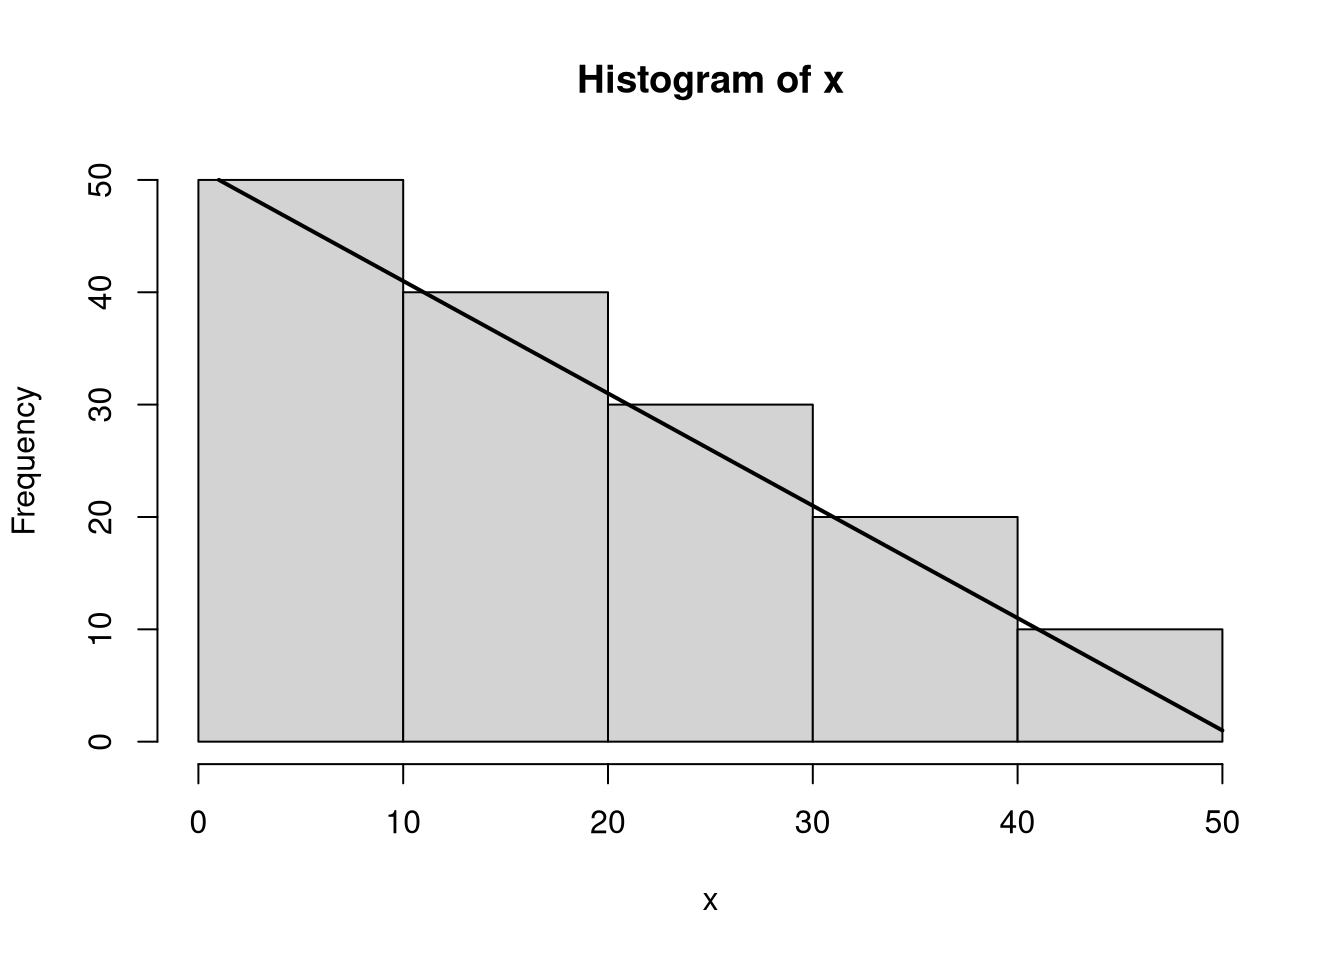
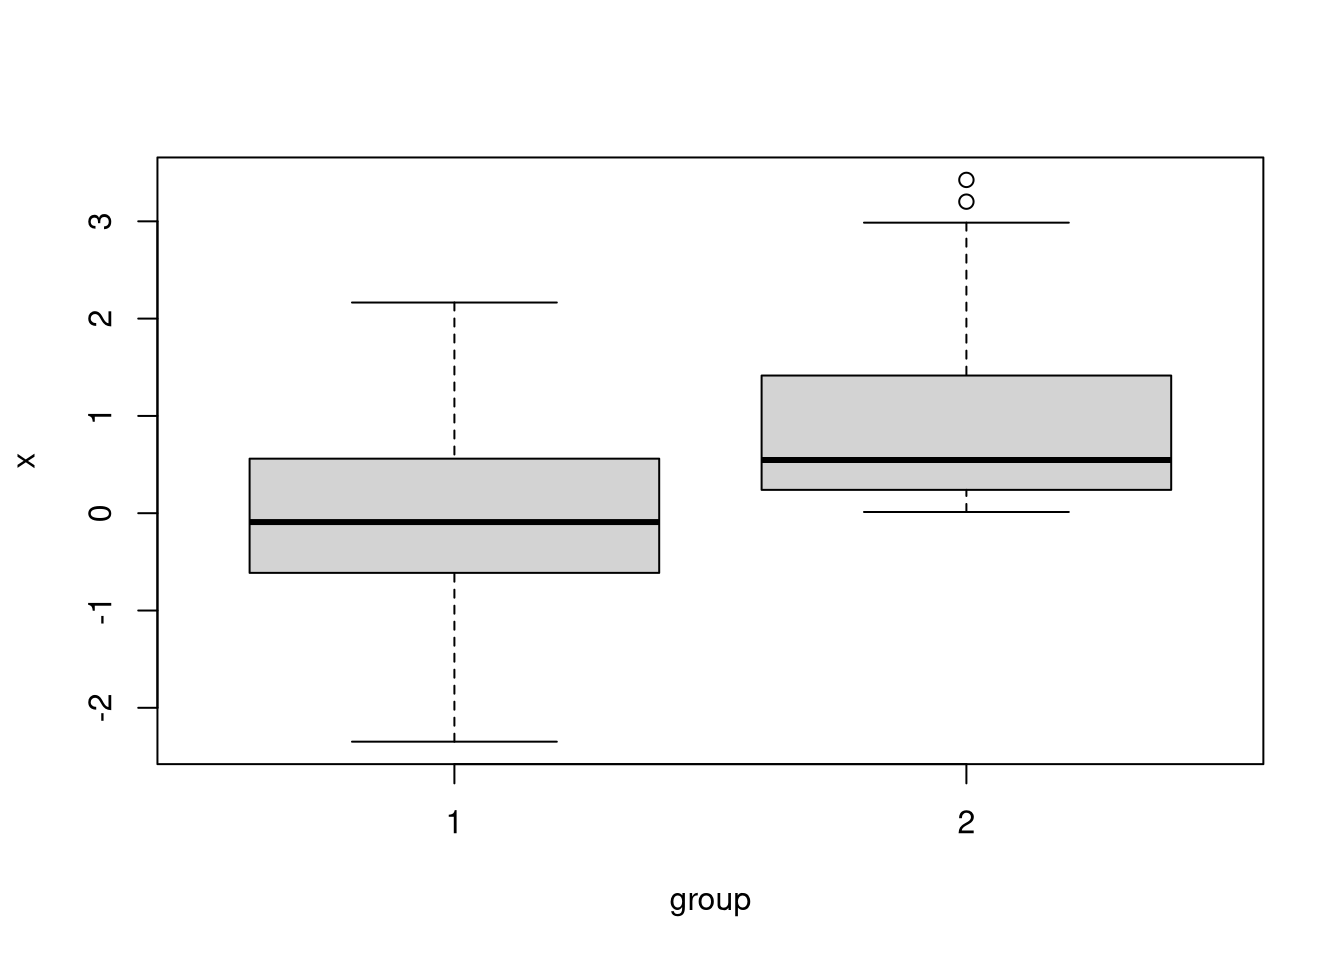
df <- data.frame(x = c(rnorm(100), rexp(100)), group = rep(1:2, each = 100)).df <- data.frame(x = c(rnorm(100), rexp(100)), group = rep(1:2, each = 100))x.boxplot(x)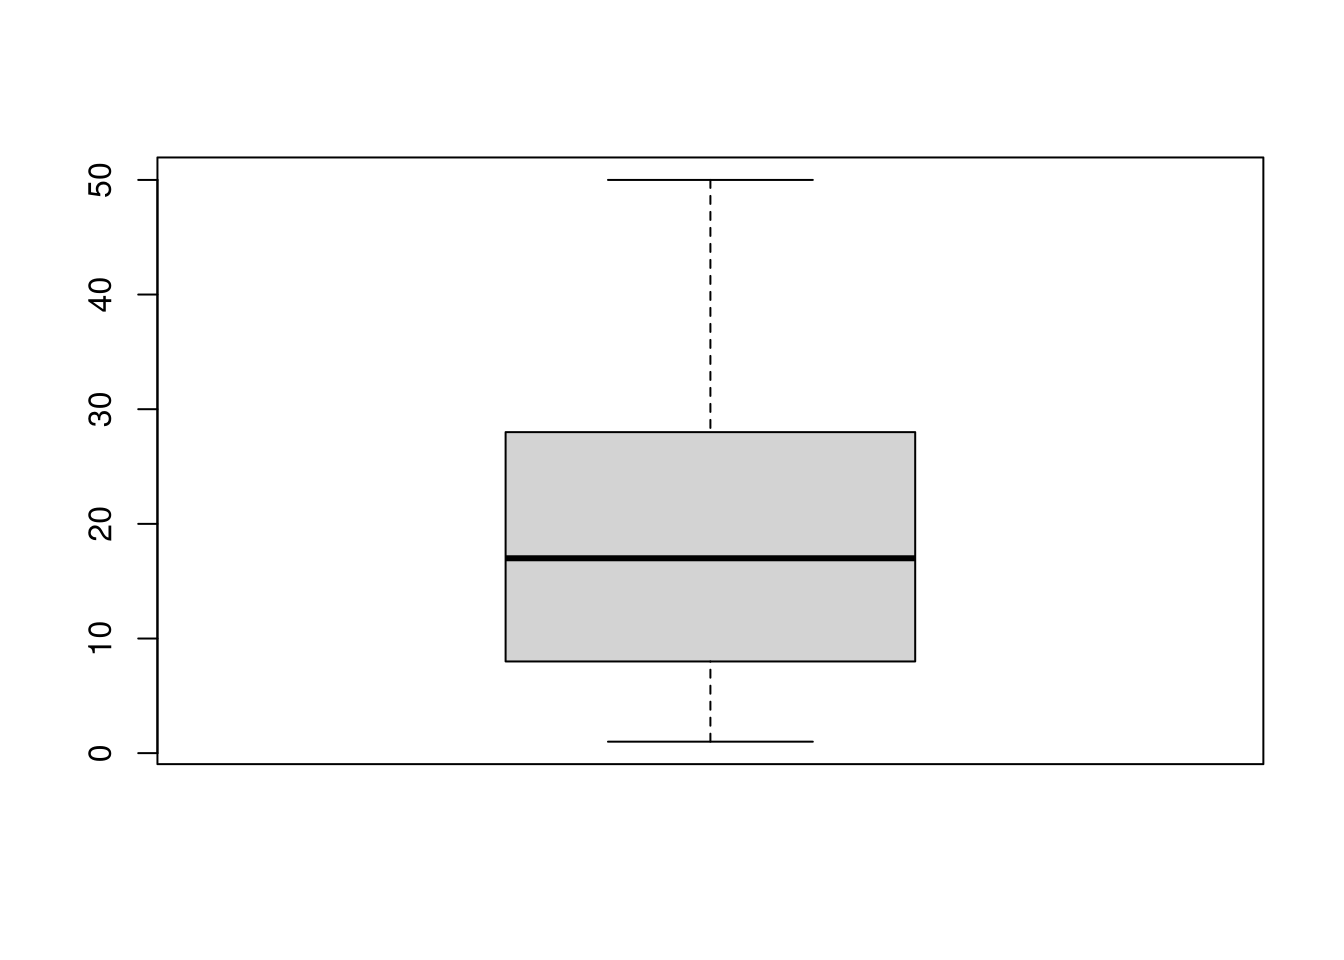
boxplot(x~group, data = df)