library(ggplot2)
data("Orange")Exercise 3: Solutions First part
Task 1.1
Load the data set Orange that contains only three variables.
Task 1.2
Plot the two variables age and circumference against each other using a scatter plot (geom_point)
ggplot(Orange, aes(age, circumference))+
  geom_point()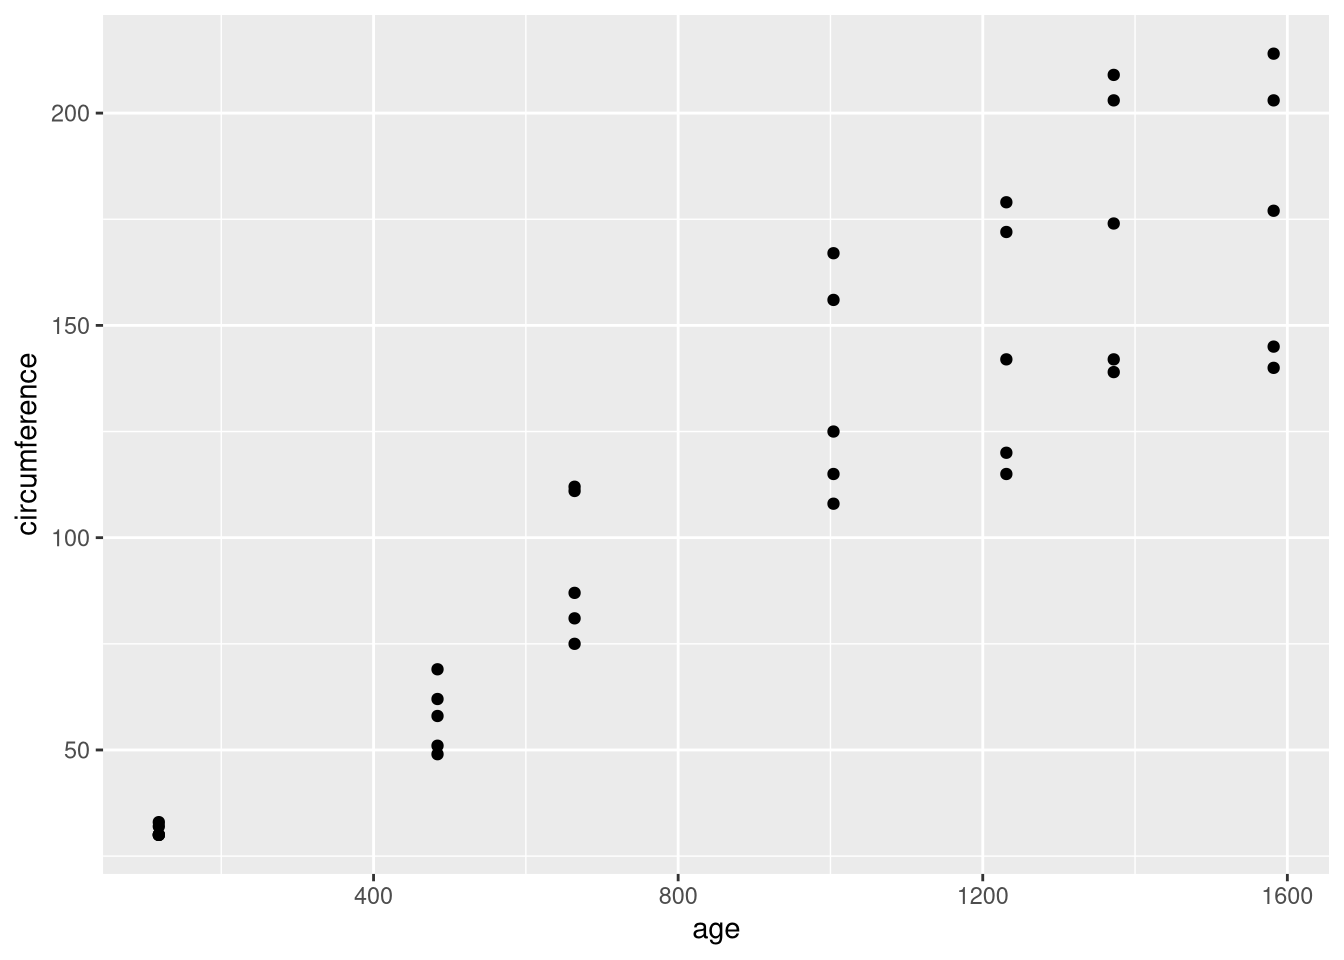
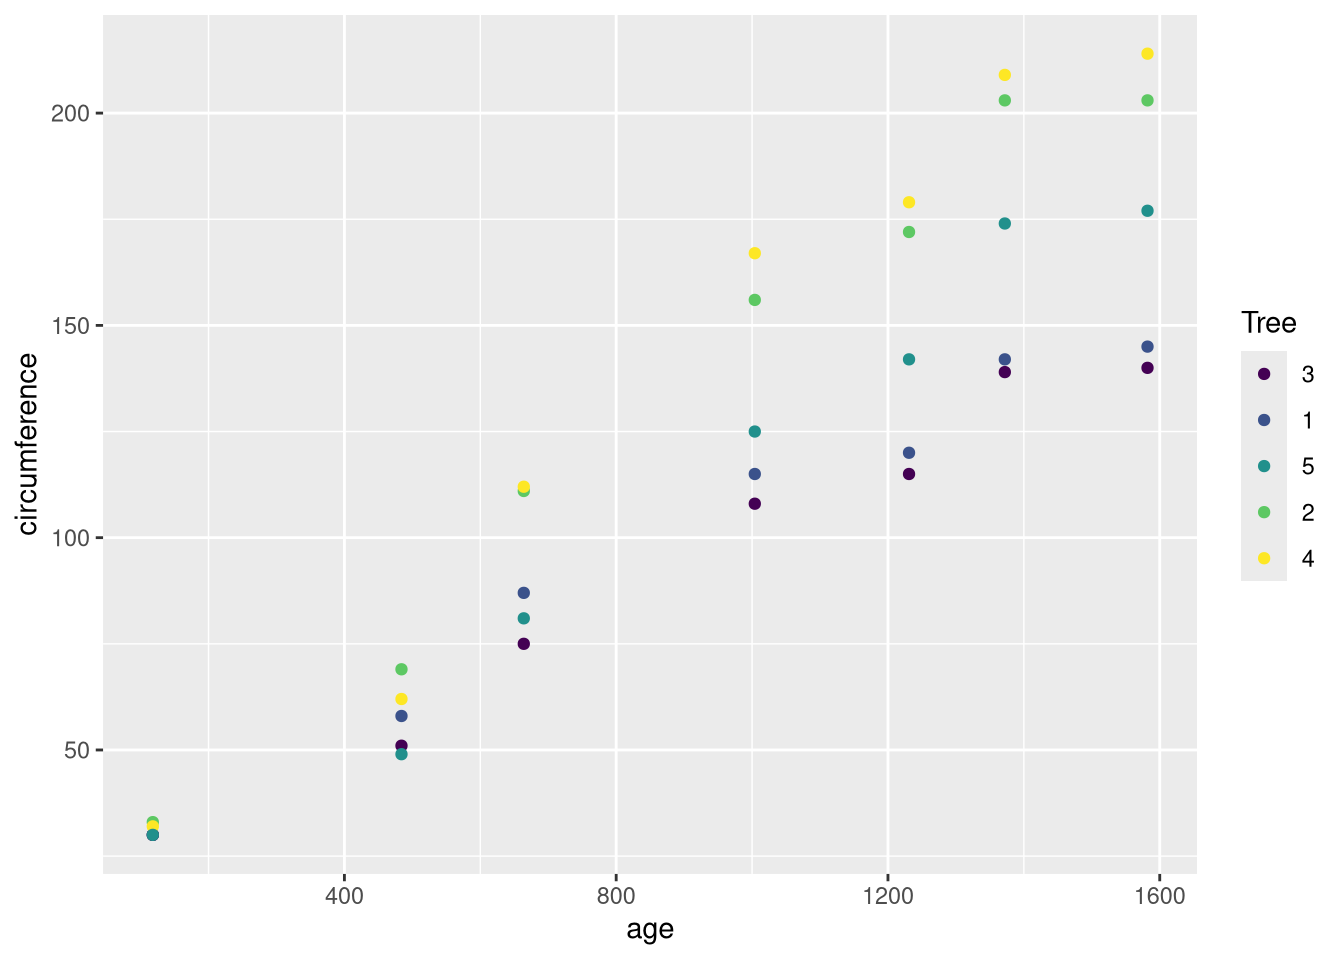
Task 1.3
Add color as an additional aesthetic mapping for the variable Tree.
ggplot(Orange, aes(age, circumference, color = Tree))+
  geom_point()