ggplot(Orange, aes(age, circumference, color = Tree))+
  geom_line()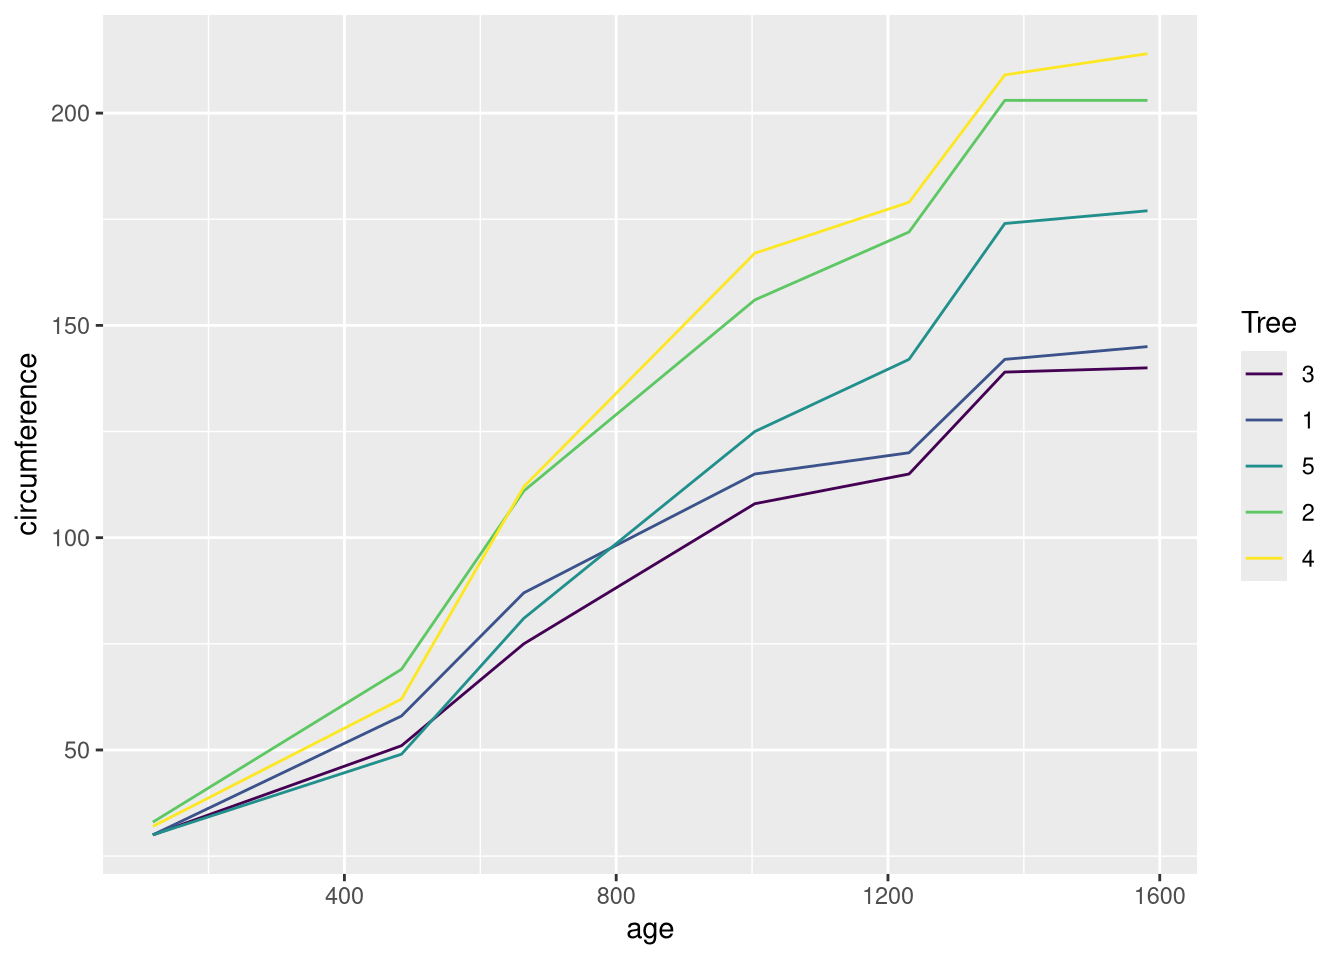
geom_lineggplot(Orange, aes(age, circumference, color = Tree))+
geom_line()
library(cowplot)
g1 <- ggplot(Orange, aes(age, circumference, color = Tree))+
  geom_point()
g2 <- ggplot(Orange, aes(age, circumference, color = Tree))+
  geom_line()

plot_grid(g1,g2)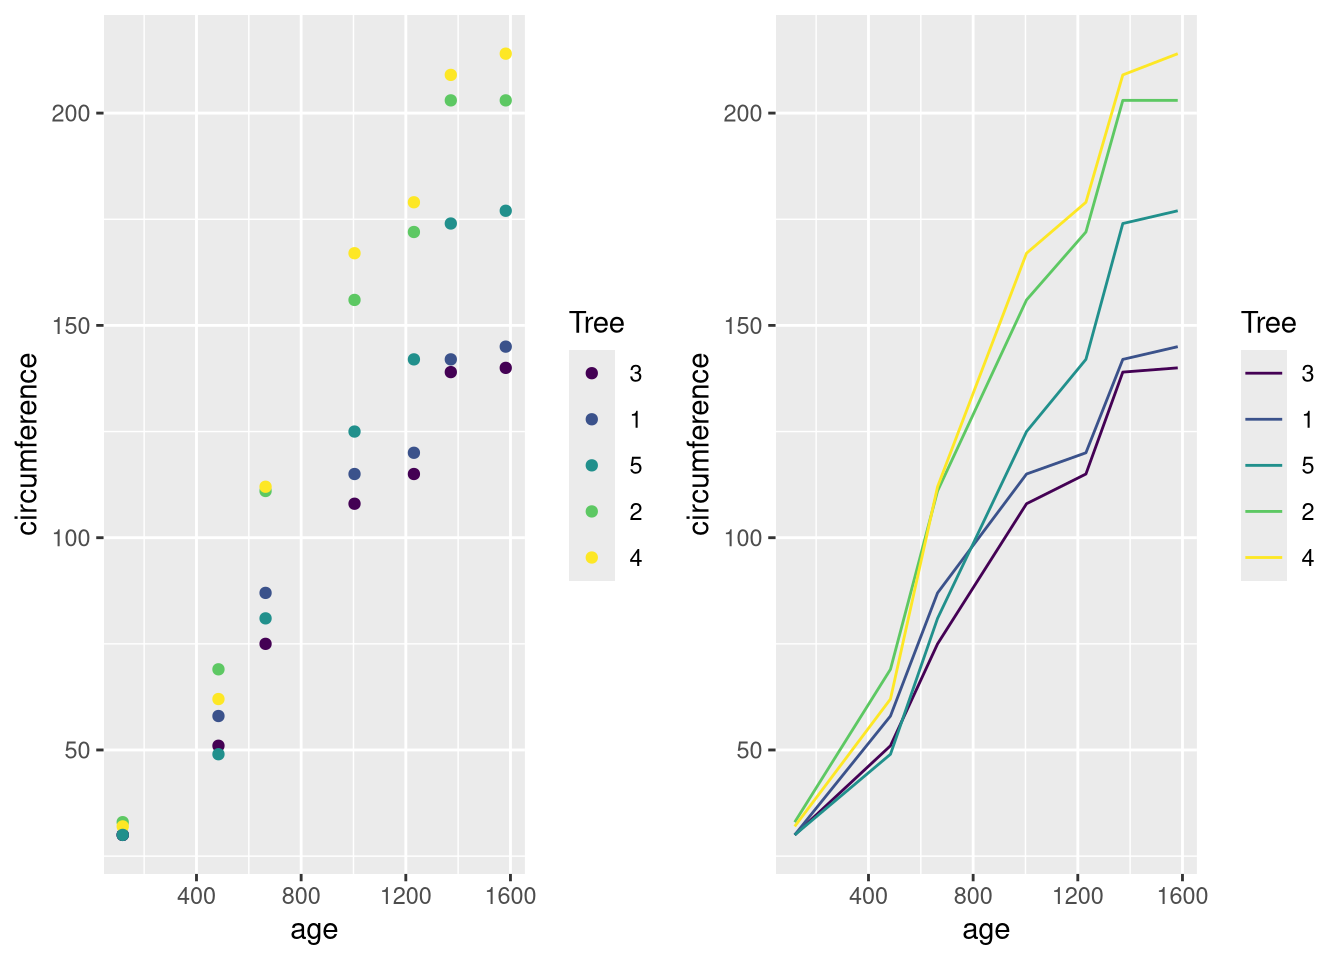
+ facet_wrap(~Tree). What does the function do?ggplot(Orange, aes(age, circumference, color = Tree))+
geom_point()+
geom_line()+
facet_wrap(~Tree)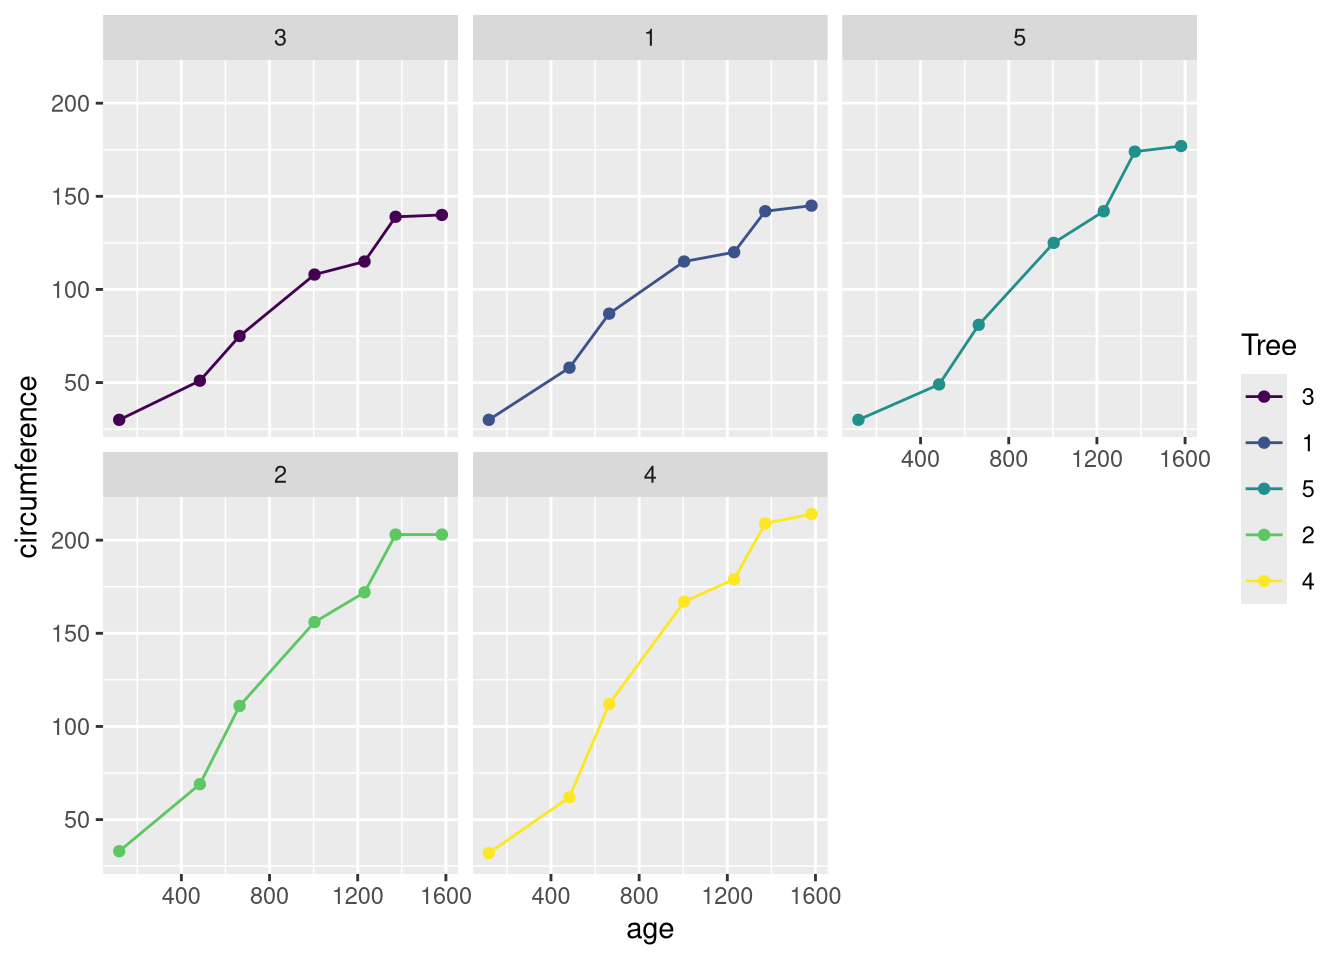
The function uses the variable Tree to make a sub-plot for each value of the variable.