data("ChickWeight")Exercise 3: Solutions third part
Task 3.1
In this task we use the data set ChickWeight. Load the data set from the package datasets.
Task 3.2
Plot the distribution of the variable weight using a histogram.
ggplot(ChickWeight)+
  geom_histogram(aes(weight))
`stat_bin()` using `bins = 30`. Pick better value with `binwidth`.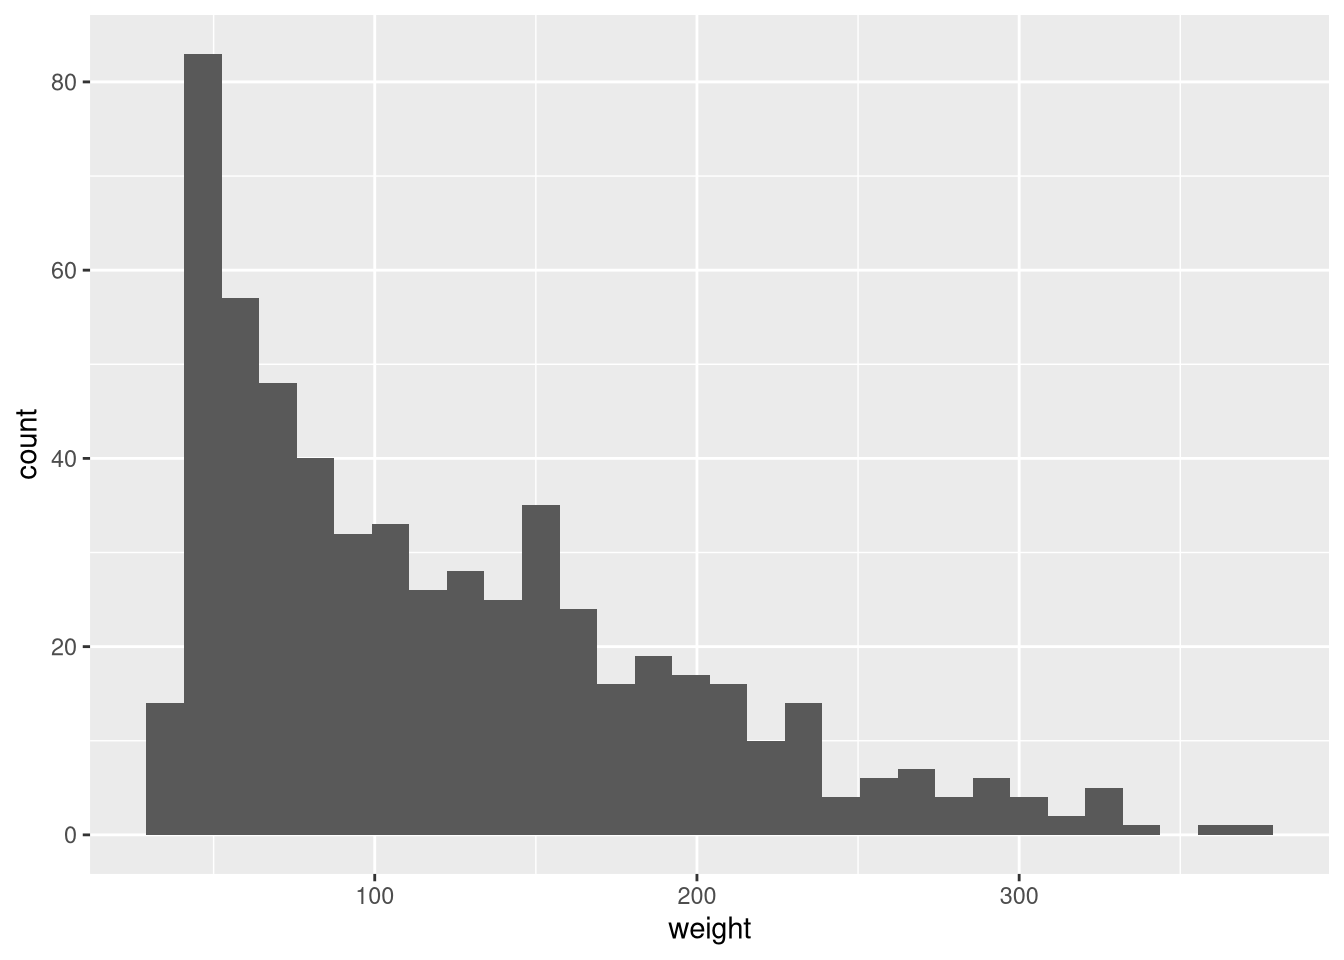
Task 3.3
Change the data type of the variable Time to a factor.
ChickWeight$Time <- as.factor(ChickWeight$Time)Task 3.4
Plot a boxplot for each time point.
ggplot(ChickWeight, aes(Time, weight))+
    geom_boxplot()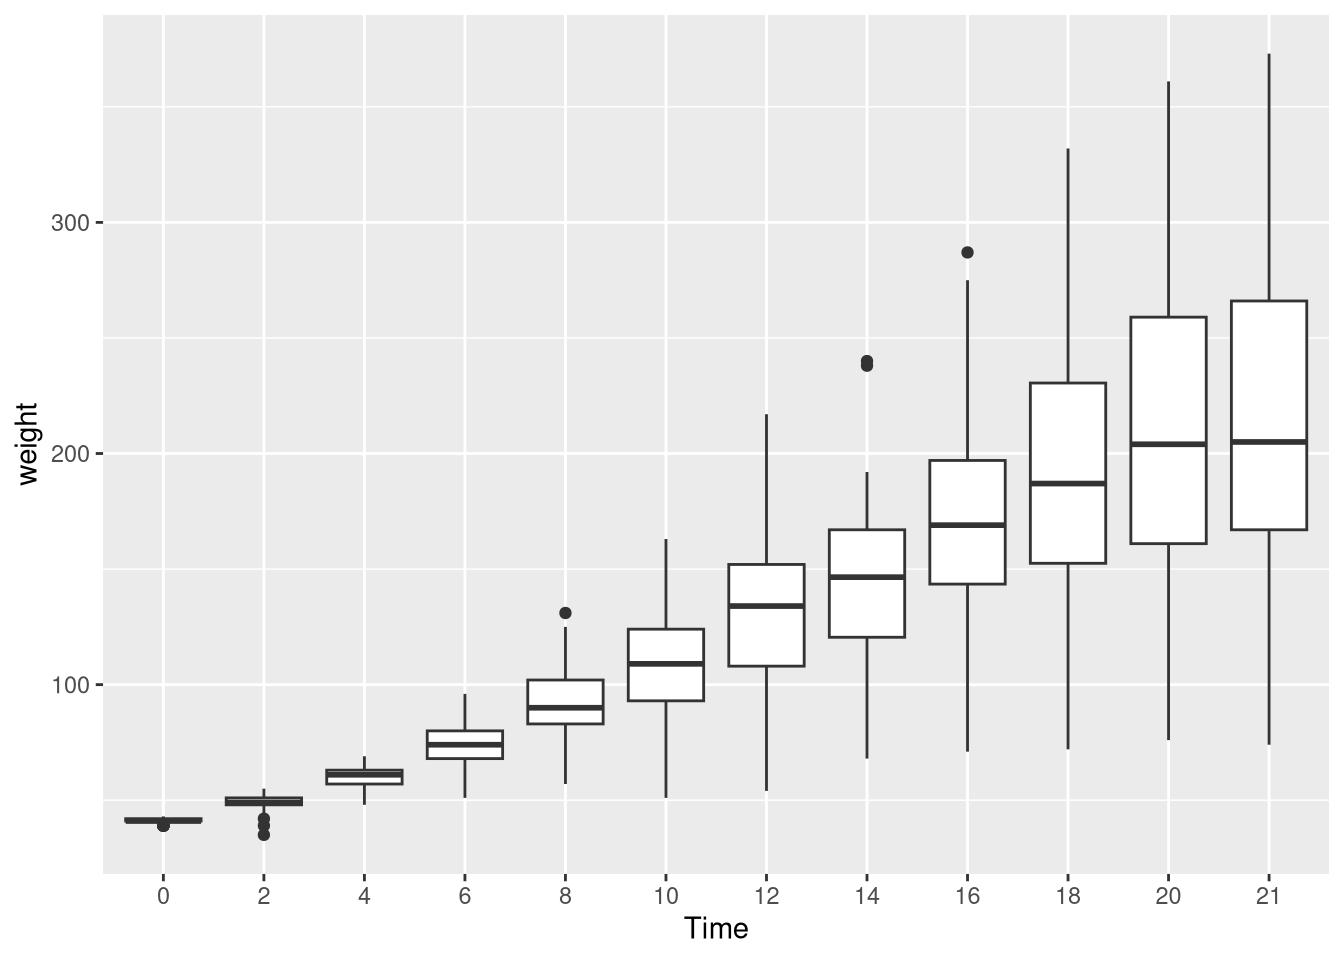
Task 3.5
Plot the weight as boxplots for the different types of Diet.
ggplot(ChickWeight, aes(Diet, weight))+
    geom_boxplot()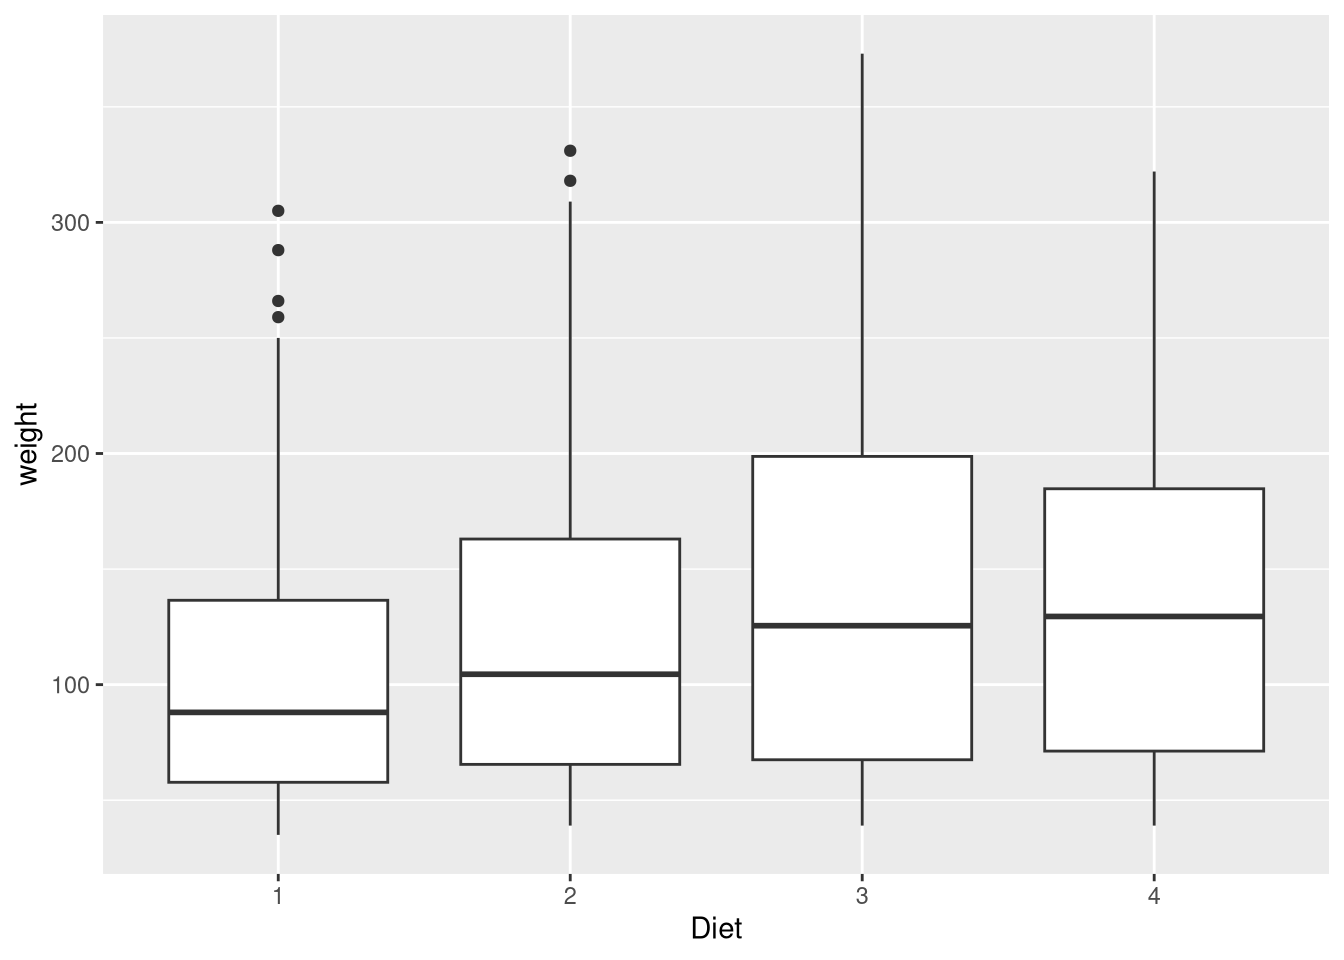
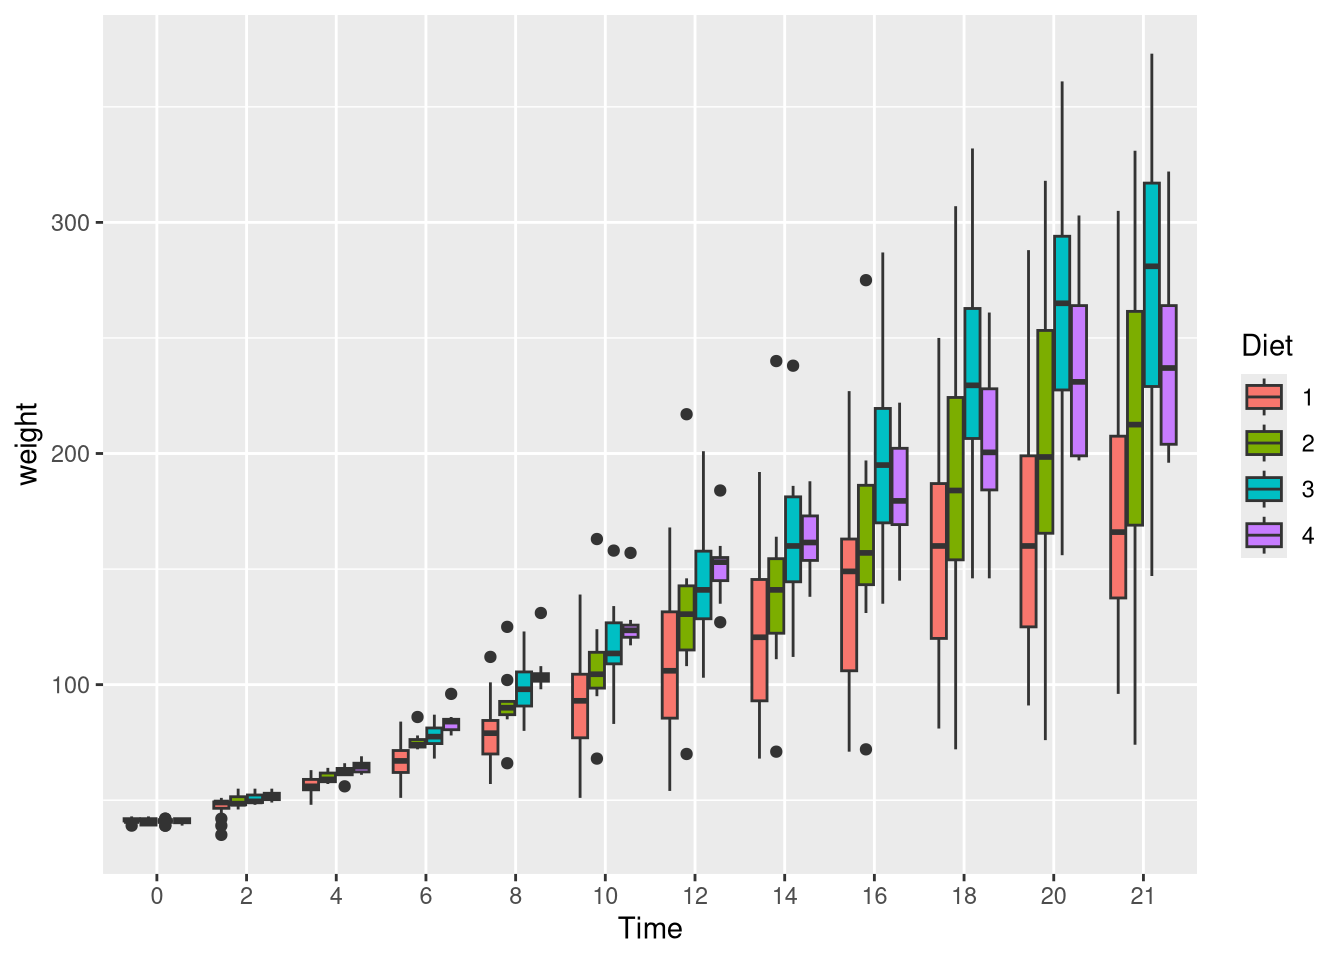
Task 3.6
Do the same, as before, but now combine the three variables: Use Time on the x-axis, weight on the y-axis and use Diet as a fill argument.
ggplot(ChickWeight, aes(Time, weight, fill=Diet))+
    geom_boxplot()